Key to Unlock hidden
relationships, patterns and
insights with
Data Visualization
Learn More


Companies rely on the insights drawn out of data for formulating strategies and decision-making at different levels. More data more outcome? Not every time and not by everyone, to draw meaningful insights out of raw data is arduous. Data visualization is the key to unlock the stories that data hides.
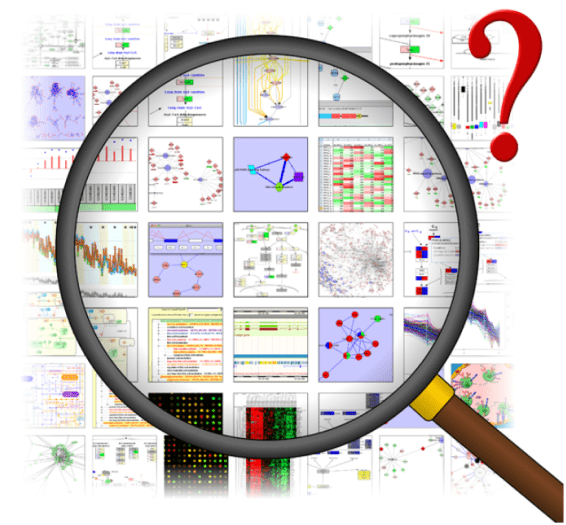
Data visualization is an action taken to translate the large data sets and metrics into charts, graphs and other visuals. The visual representation of data makes it convenient to draw to useful insights, discover and share the real-time trends about the information provided in the data. The process of visualization is not restricted to presenting the data in pictorial or graphical form but a way to interact with it and look how it’s processed.
Data visualization depicts a clear picture allowing users to conclude meaningful observations of large data sets with charts, tables, graphs, maps, etc.
Required information and necessary insights can be drawn out of data by the end-users without consulting the IT departments in the particular organisation in decision making. The users enjoy to be self-subsistent.
Data visualisation helps the user to draw attention on required areas along with defining the fields in a certain pattern. It is beneficial in elimination of unnecessary tasks to focus on the relevant in order to implement essential changes.
We assure that when your data reaches the high-level executives, your dashboards help answer every possible critical business question. Now is the time to rethink your approach and prompt data users to take action, in no time.
Data Visualisation

Let’s transfigure massive and critical data into Fruitful Solutions with MoogleLabs
Data mining and visualization consumes numerous hours, resulting in unproductivity in the core areas which can have adverse effects in the long run, MoogleLabs is complemented with the team specializing in data cleansing, blending, quickly and spontaneously catch the important data. . We help in generating solutions that allow companies to create a 360-degree view of their business along with finding patterns, trends, and correlations. All of this helps the business owner to improve their decision-making powers irrespective of what industry you’re in.

Reports will be formed as per the business users related to their roles. We customize and form the relevant reports and dashboards for particular users and roles.

Looking into data from multiple viewpoints, your advertising ROI can be broken down for a quarter of the channel to identify underperforming factors.

Visualisation tools depict the data in clear way allowing users to understand and develop plans out of it.

The advanced data visualisation tools enable the users to visualize real-time data in different formats and unlock the value of data.
Case Studies